Analytics & Reports
Understand your hiring performance: how fast you hire, where candidates come from, where they drop off, and how each role is doing — with exportable reports for sharing.
Overview
Analytics turns your pipeline activity into numbers you can act on. Open Analytics from the sidebar for a company-wide view, or open a single job's Analytics tab for role-level detail.
Analytics Dashboard
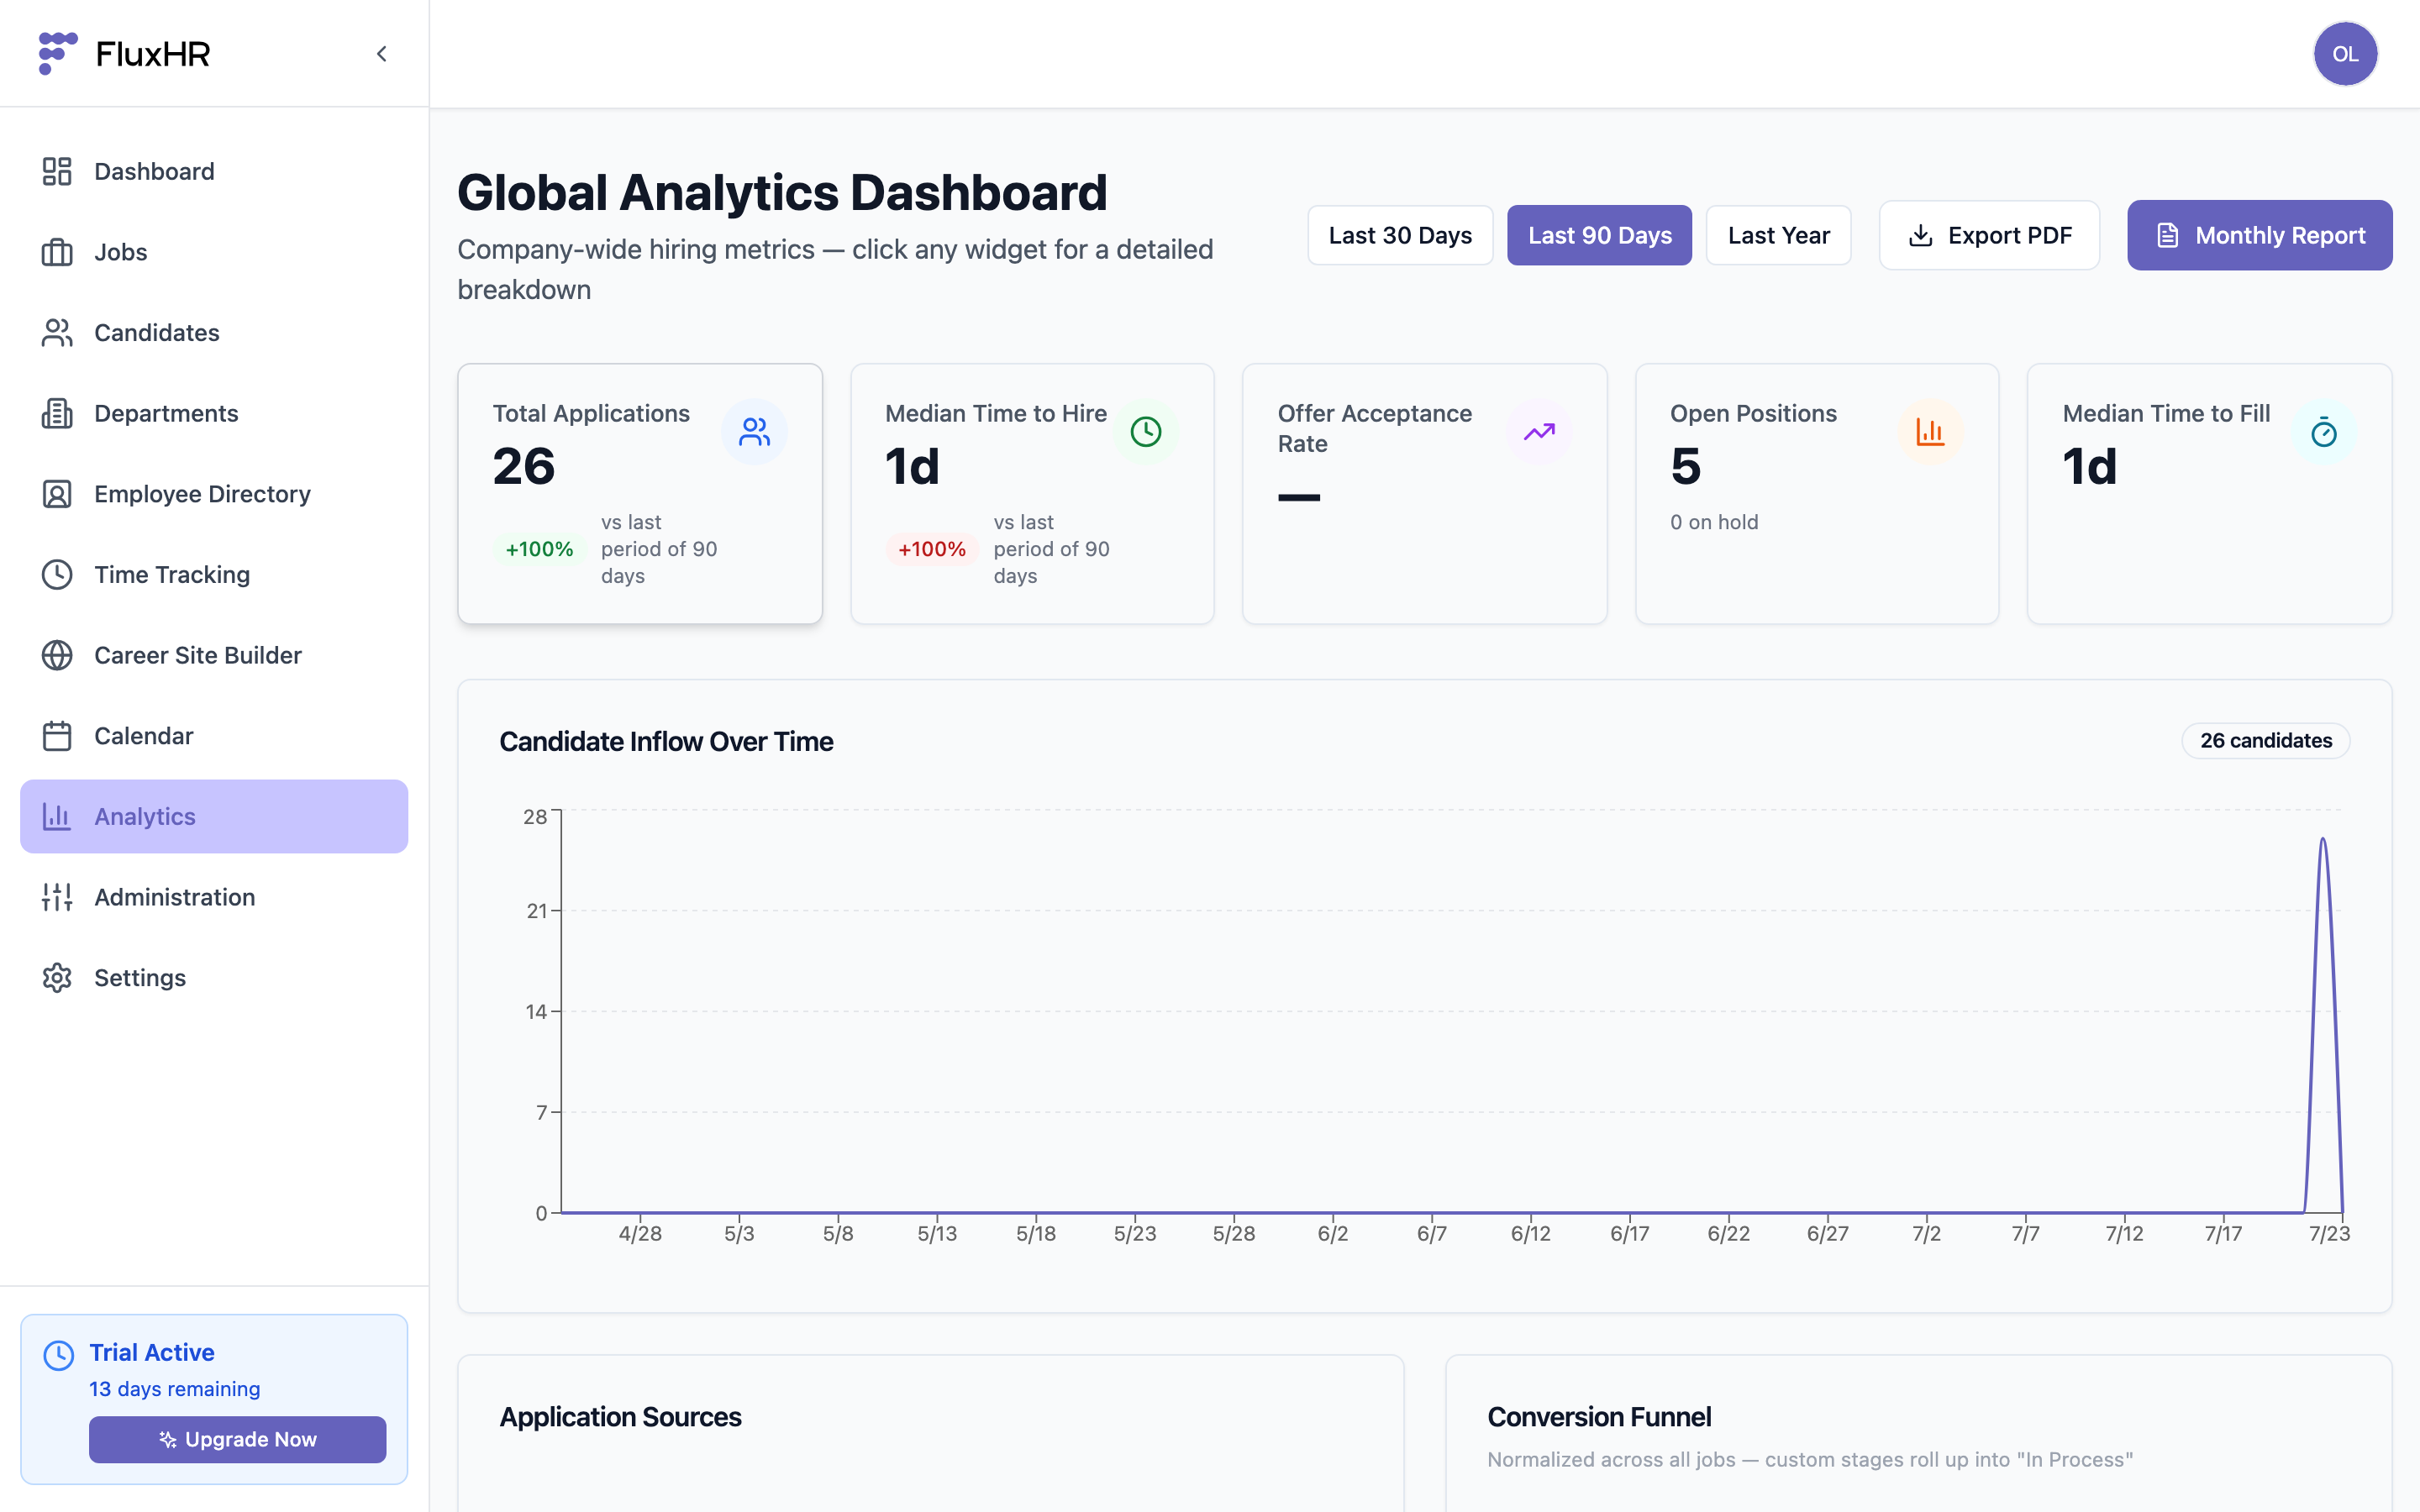
The Global Analytics Dashboard summarizes company-wide hiring. Choose a time range (Last 30 Days, Last 90 Days, Last Year) and click any widget for a detailed breakdown.
Key Metrics
The KPI tiles across the top track the numbers that matter most:
- Total Applications — volume in the selected period, with change vs. the previous period.
- Median Time to Hire — from application to hire.
- Offer Acceptance Rate — share of offers accepted.
- Open Positions — active roles (and how many are on hold).
- Median Time to Fill — from opening a role to filling it.
Funnel & Sources
Below the KPIs:
- Candidate Inflow Over Time — applications per day, to spot spikes and dry spells.
- Application Sources — where candidates come from (career site, LinkedIn, referrals, imports).
- Conversion Funnel — how candidates progress stage-to-stage, normalized across all jobs, so you can see where people drop off.
Per-Job Analytics
Open any job and switch to its Analytics tab for the same metrics scoped to that single role — useful for comparing how different positions perform and spotting a stalled pipeline early.
Reports & Export
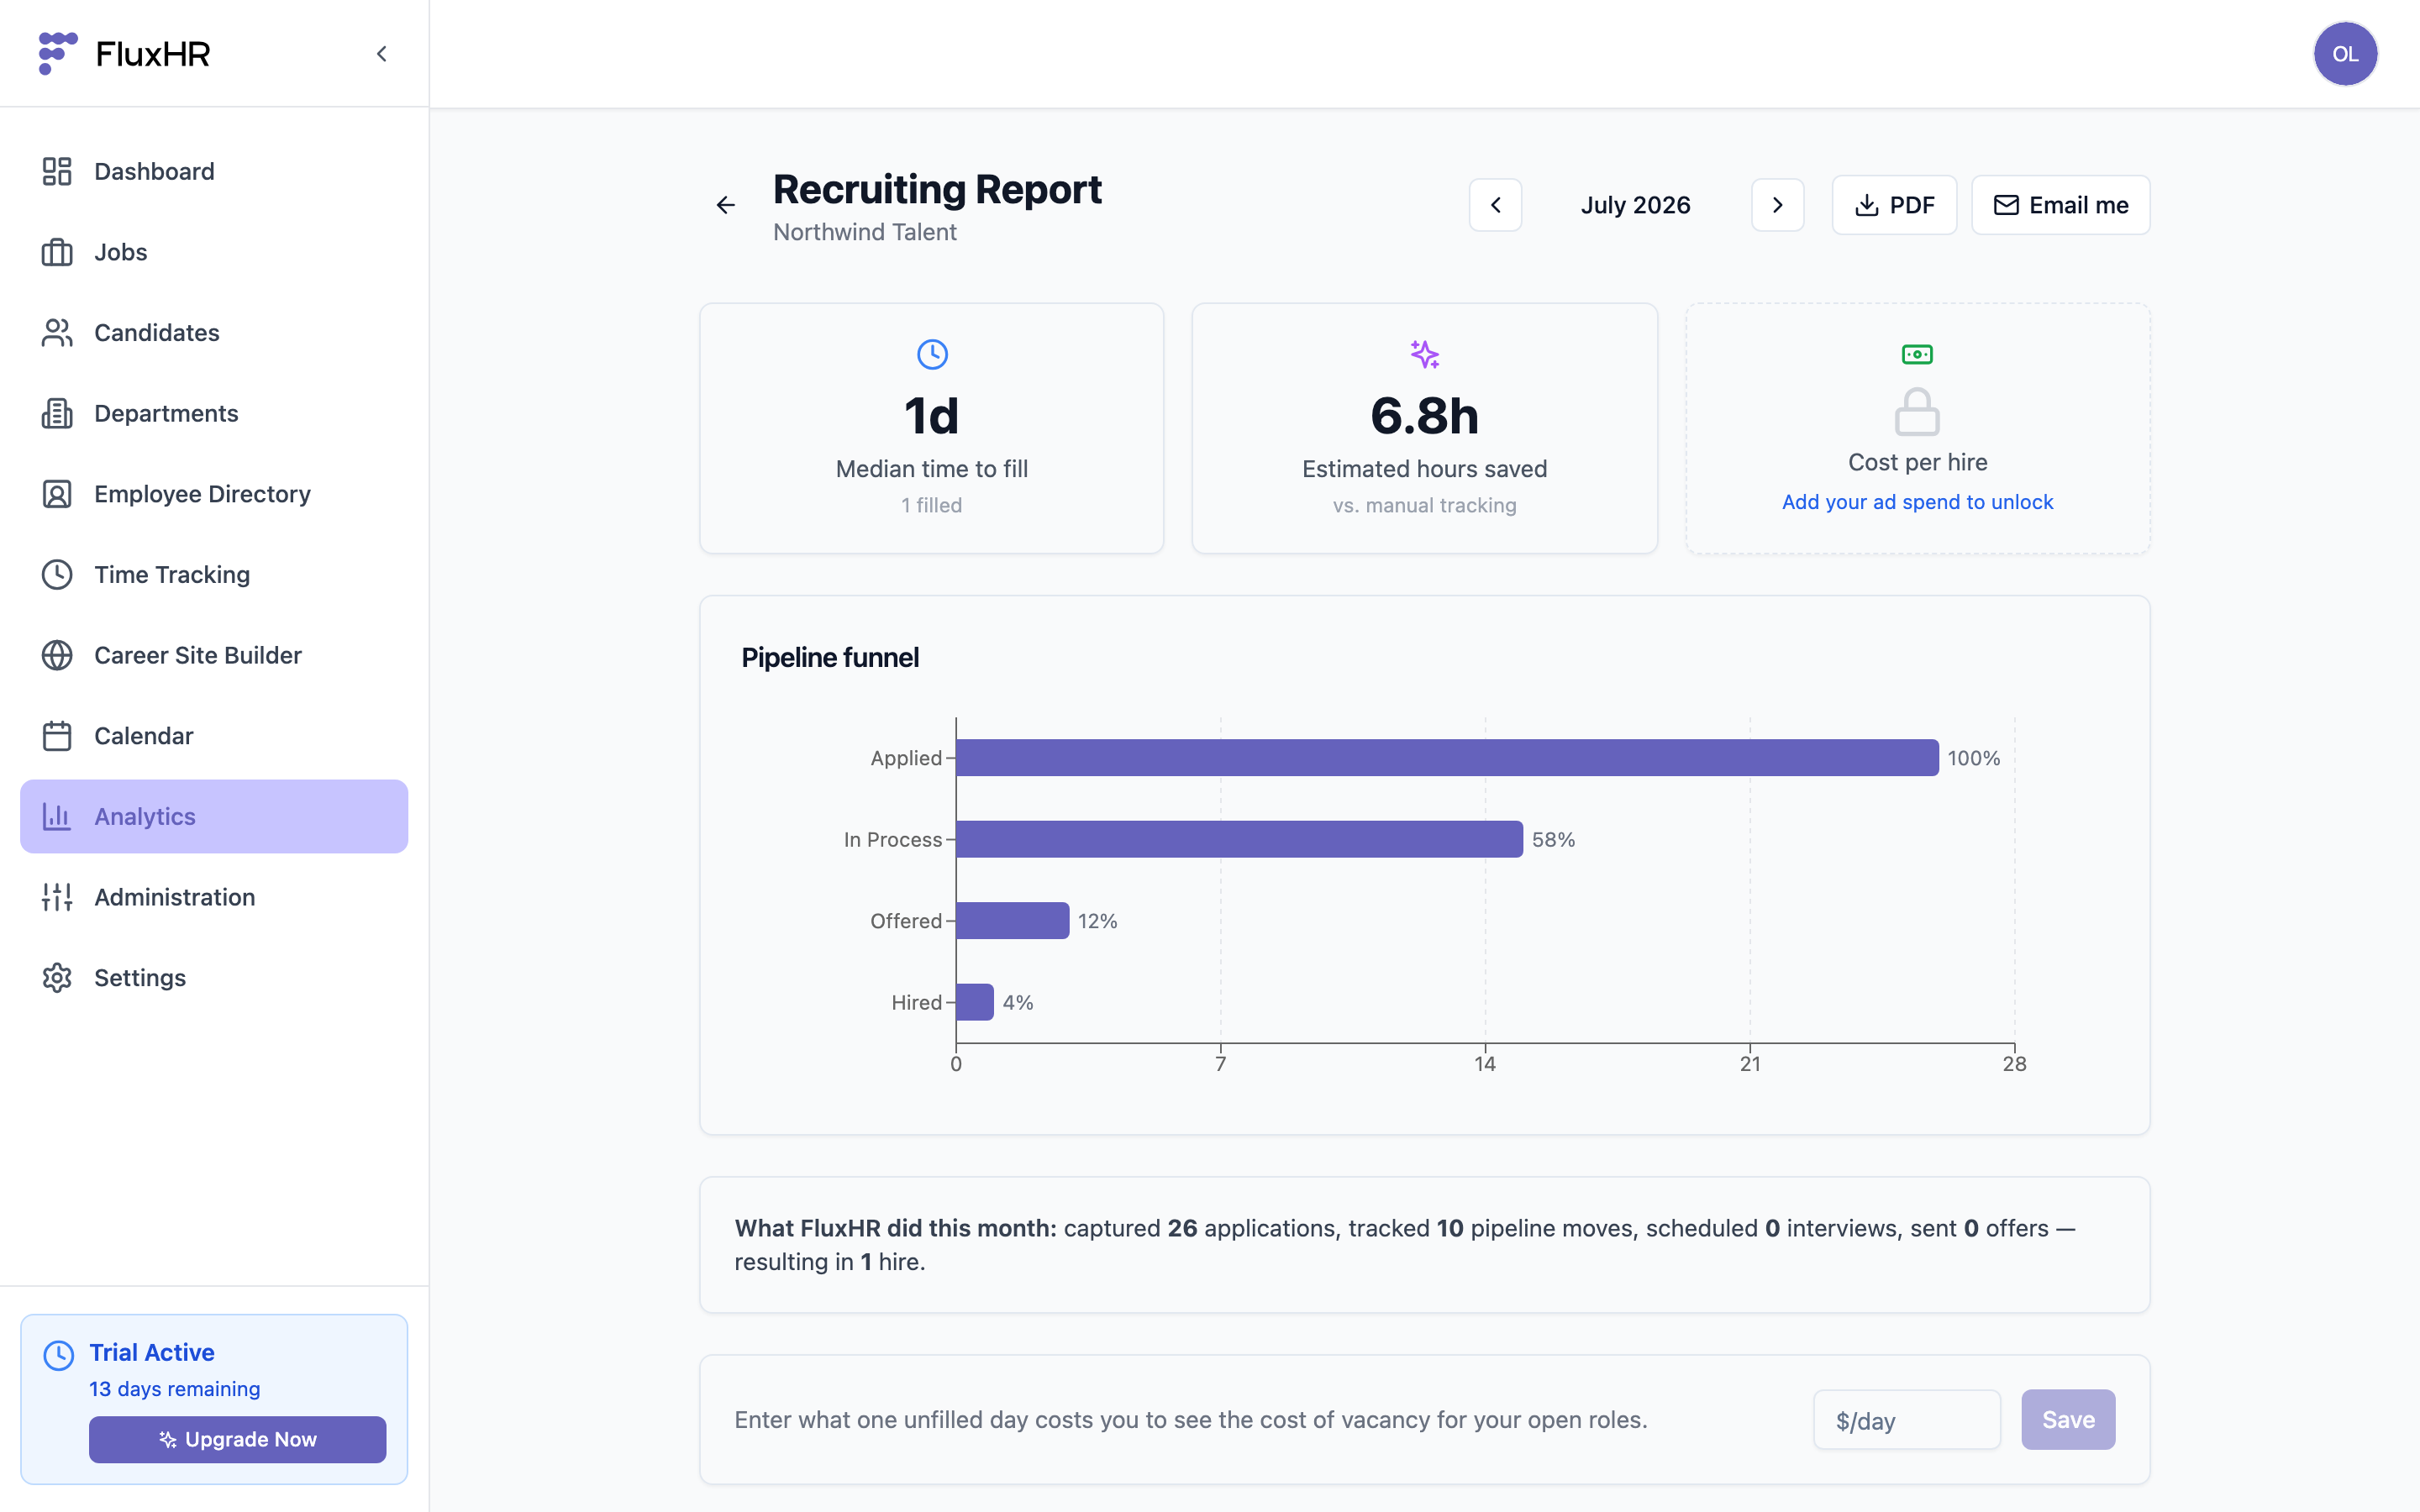
Need to share numbers? Use Export PDF for a snapshot of the current dashboard, or open the Monthly Report for a formatted, period-over-period summary you can send to stakeholders.